

Sunday morning, the notification slides in: your screen time was up 14% last week, an average of five hours and something a day.
It lands like a school report. You did not feel like someone who spent five hours a day on a phone. Now you feel like someone who should be ashamed of it.
That small jolt of guilt has a long back catalogue of headlines behind it. In 2017 the psychologist Jean Twenge, of San Diego State University, published an essay in The Atlantic under the title “Have Smartphones Destroyed a Generation?” It was shared widely, quoted endlessly, and helped set the tone for a decade of anxious coverage.
Here is the twist. In the same year, a study of more than 120,000 teenagers in England found that moderate screen use was not linked to lower wellbeing at all. Two years later, an analysis of 355,358 young people found that technology use explained at most 0.4% of the differences in their wellbeing.
That is roughly the same association the researchers found for regularly eating potatoes.
None of this means screens are harmless, and the argument among researchers is far from settled. But the evidence is much stranger, and more useful, than the number on your lock screen suggests.
The Goldilocks study: 120,000 teenagers and a curve, not a cliff
In 2017 Andrew Przybylski, of the Oxford Internet Institute, and Netta Weinstein, then at Cardiff University, published a large test of what they called the “digital Goldilocks hypothesis” in Psychological Science. The idea was simple: too little screen time might cut young people off from their friends, too much might crowd out other things, and somewhere in between might be just right.
They drew on survey answers from 120,115 15-year-olds in England. Each teenager reported how long they spent watching films and TV, playing games, using computers and using smartphones, on weekdays and at weekends. Each also completed the Warwick-Edinburgh Mental Well-Being Scale, a standard 14-item questionnaire about feeling optimistic, useful, relaxed and close to other people.
The results did not look like a cliff. For most activities, wellbeing rose slightly with moderate use, levelled off, and only started to dip after a tipping point. The authors concluded that moderate use of digital technology “is not intrinsically harmful and may be advantageous in a connected world.”
The tipping points themselves, reported by the Oxford Internet Institute, were more generous than most parents would guess.
| Activity | Weekday tipping point | Weekend tipping point |
|---|---|---|
| Video games | 1 hr 40 min | 3 hr 35 min |
| Smartphones | 1 hr 57 min | Not reported |
| Films and TV | 3 hr 41 min | 4 hr 50 min |
| Computers | 4 hr 17 min | Not reported |
Two cautions apply. The data were a snapshot, so they show association rather than cause. And the hours were self-reported, which matters more than it sounds: people are notoriously poor at estimating how long they spend on their phones.



Potatoes, glasses and the 0.4% finding
The 2019 study that produced the potato comparison was really about method, not screens.
Amy Orben and Andrew Przybylski, both at Oxford at the time, noticed that researchers working on the same big datasets kept reaching different conclusions. Some found worrying links between technology and teenage wellbeing. Others found almost nothing. The difference often came down to choices made quietly during analysis: which questions counted as “technology use”, which counted as “wellbeing”, which other factors to control for.
So they used a technique called specification curve analysis. In plain terms, a specification curve runs every reasonable version of the same analysis and lines up all the answers, so no single convenient result can be cherry-picked.
They applied it to three large surveys: Monitoring the Future and the Youth Risk Behavior Survey in the United States, and the UK’s Millennium Cohort Study. In total, their paper in Nature Human Behaviour covered 355,358 adolescents. According to the Oxford press release, the data allowed more than 600 million possible ways of analysing them, and the team calculated a large sample of those routes.
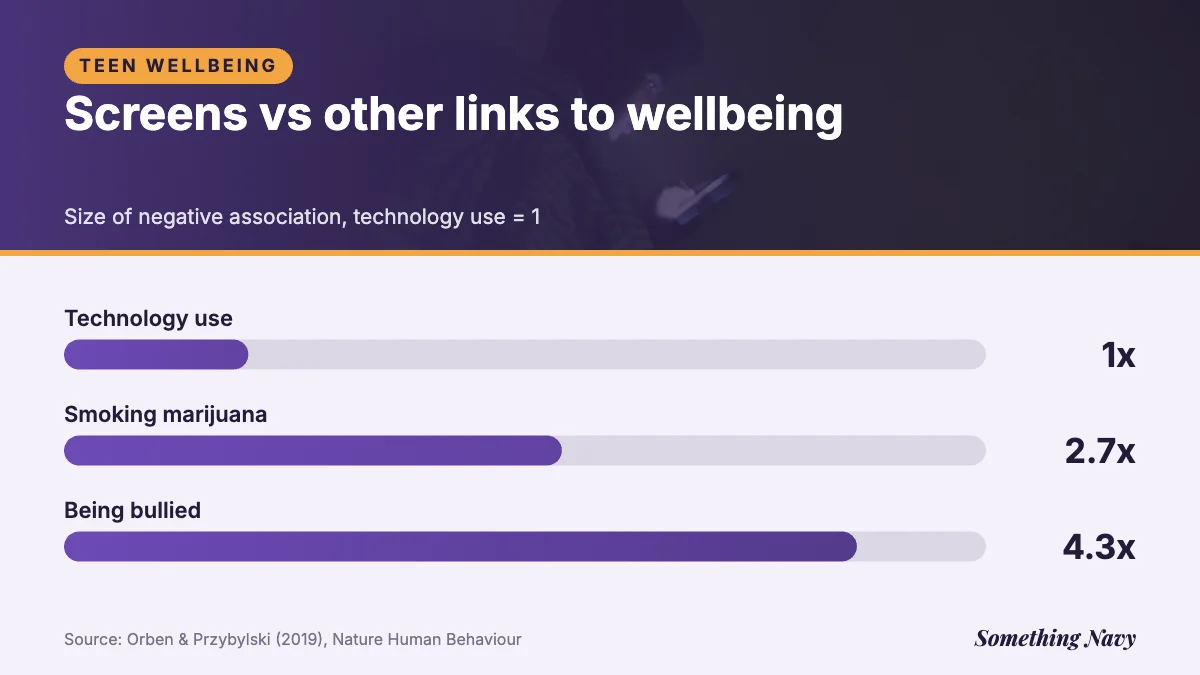
The association between technology use and wellbeing was negative, but tiny. At most, it explained 0.4% of the variation in how young people felt.
To make that number tangible, the researchers set it beside other things measured in the same surveys. Being bullied had a negative association 4.3 times larger. Smoking marijuana was 2.7 times larger. Getting enough sleep and eating breakfast were far more strongly linked to wellbeing than screens. Wearing glasses had a more negative association than technology use, and regularly eating potatoes was nearly as negative.
Przybylski summed it up bluntly: screen use “has at most a tiny association with youth mental health.”
A fair reading needs two footnotes. First, 0.4% is an average across hundreds of thousands of people. A small average can hide a group who are struggling badly alongside many who are unaffected or helped. Second, the study lumped together everything from TV to social media. A common objection is that this blend dilutes any sharper signal for specific platforms, or for particular ages. That objection turned out to have something to it, as later work showed.
A short timeline of the screen-time debate
The argument has moved quickly, and the order of events explains a lot about why the headlines feel so contradictory.
- 2015: Psychologists in Belgium and Michigan publish lab and daily-life evidence that passively scrolling Facebook lowers mood, partly through envy.
- 2017: Twenge’s Atlantic essay appears. Przybylski and Weinstein publish the Goldilocks study of 120,115 teenagers.
- 2019: Orben and Przybylski report that technology use explains at most 0.4% of adolescent wellbeing.
- 2022: Orben and colleagues identify specific ages when social media use is more strongly linked to lower life satisfaction. A review finds the “active versus passive” idea mostly unsupported.
- 2023: The US Surgeon General issues an advisory on social media and youth mental health.
- 2024: Jonathan Haidt publishes The Anxious Generation; Candice Odgers critiques it in Nature. The Surgeon General calls for warning labels on social media.
- 2025: Australia’s minimum age of 16 for social media accounts takes effect on 10 December.
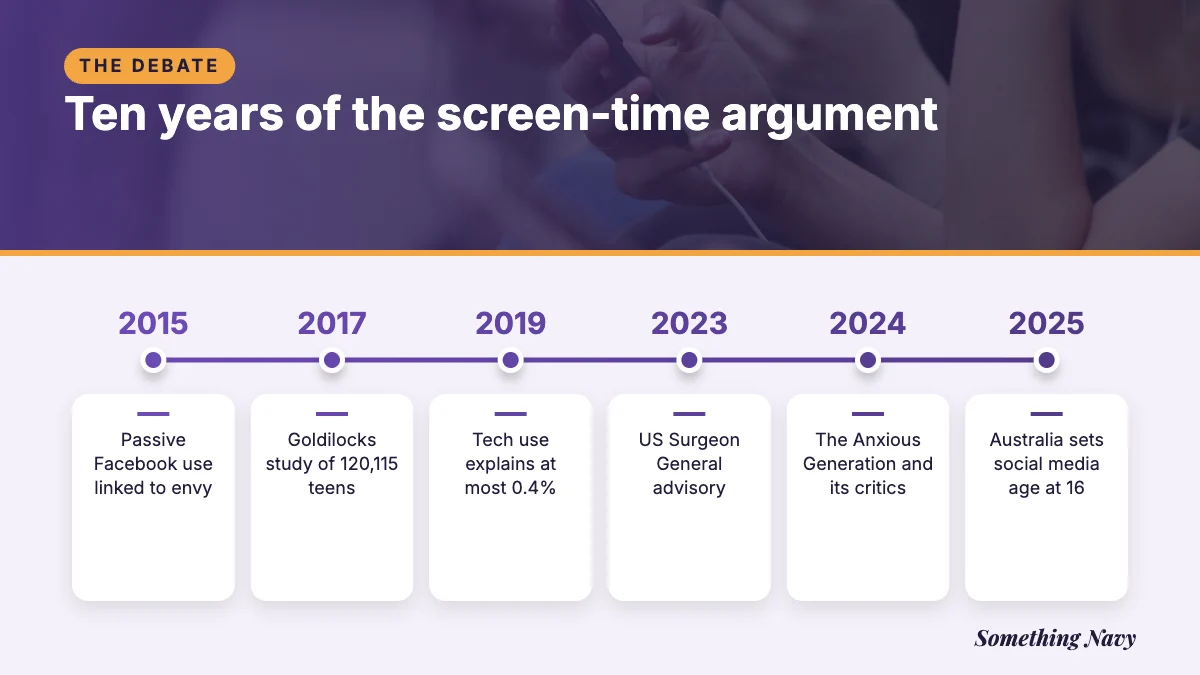
Notice the shift. The early fight was about hours. The later one is about which platforms, which children, and at what age.
Screen time myths versus what the evidence shows
Most of the guilt that arrives with a weekly report rests on a handful of assumptions. Some hold up. Several do not.
Myth: every extra hour does a little more damage
This is the “dose” model, borrowed from smoking: more exposure, more harm, in a straight line. The Goldilocks study is the clearest evidence against it, at least for typical use. The curve was flat or slightly upward for moderate amounts and only turned down beyond a threshold.
Hours are also a strange thing to measure. An hour video-calling a grandparent, an hour on a language app and an hour of doomscrolling through bad news at midnight all register identically on your phone. Their effects on how you feel almost certainly do not.
Where hours do seem to matter is at the extremes, and in what they push out of the day. If phone time is eating into sleep, the problem may be the lost sleep as much as the phone, which is one reason late-night scrolling and revenge bedtime procrastination keep turning up in this research.
Myth: posting is healthy, scrolling is poison
This one has a real study behind it. In 2015 Philippe Verduyn, then at the University of Leuven, worked with Ethan Kross and colleagues at the University of Michigan on two studies published in the Journal of Experimental Psychology: General.
In the first, around 80 students were asked to use Facebook either actively (posting, messaging) or passively (just browsing) for 10 minutes in a lab. The passive group felt worse by the end of the day. In the second, around 80 students were texted five times a day for six days and asked how they felt and how they had used Facebook. Passive use predicted more envy, and more envy predicted lower mood. Active use did not show that pattern.
It is a tidy, intuitive story. The trouble came when others tried to generalise it.
In 2022 Patti Valkenburg, Irene van Driel and Ine Beyens at the University of Amsterdam published a critical review in New Media & Society. They examined 40 survey studies containing 172 separate associations between active or passive use and wellbeing. Most did not support the hypothesis. The studies also defined “active” and “passive” in 36 different ways, which makes them hard to compare.
Their conclusion was not that passive scrolling is fine. It was that the label is too crude. Scrolling past a friend’s holiday photos can sting; scrolling past dog videos might lift your mood. What you see, the mood you bring and how sensitive you are to comparison seem to matter more than whether your thumb is posting or swiping.
Myth: the research has shown screens are harmless
The reassuring studies are sometimes over-read in the opposite direction. Small average effects are not the same as no effects for anyone.
In 2022, Orben, Przybylski, Sarah-Jayne Blakemore and Rogier Kievit, working across Cambridge, Oxford and the Donders Institute, published a study in Nature Communications using two UK datasets covering about 84,000 people, including longitudinal data on 17,400 young people aged 10 to 21. They found “windows” of sensitivity. In girls, more social media use was linked to lower life satisfaction later on at ages 11 to 13. In boys, the window was 14 to 15. At 19, it appeared in both sexes.
That is a very different finding from “screen time is like potatoes”. It suggests that for some ages, and probably some individuals, social media in particular carries more weight than an average across everyone reveals.
A daily total tells you how long the screen was on. It cannot tell you what the screen did to you.
Myth: “screen time” is one thing
Almost every finding above changes depending on what is being counted. TV, games, homework, messaging, social media and news are folded into one number on your phone, but researchers increasingly treat them separately because they behave differently.
The sharpest concerns now focus on social media for young adolescents, not on screens as a category. That is also where official bodies have drawn their lines.


What the US Surgeon General actually said about social media
On 23 May 2023 Vivek Murthy, then US Surgeon General, published an advisory on social media and youth mental health. It is often summarised as “social media is harmful”, but the wording was more careful.
It noted that up to 95% of 13- to 17-year-olds in the US use a social media platform, and about a third say they use it almost constantly. It cited research suggesting that adolescents who spend more than three hours a day on social media face double the risk of poor mental health outcomes, including symptoms of depression and anxiety. On average, teens were spending about 3.5 hours a day on it.
It also said social media brings benefits as well as risks. Its central line was a statement about uncertainty: “We cannot conclude that social media is sufficiently safe for children and adolescents.”
That is a precautionary judgement, not proof of harm. In June 2024 Murthy went further, calling on Congress to require warning labels on social media platforms.
Haidt versus Odgers: where the real disagreement lies
The public debate sharpened in March 2024 when Jonathan Haidt, a social psychologist at New York University, published The Anxious Generation. He argued that the move to a phone-based childhood, alongside overprotective parenting offline, helped drive a sharp rise in anxiety and depression among young people from the early 2010s.
Candice Odgers, a developmental psychologist at the University of California, Irvine, reviewed it in Nature. She argued that the evidence does not support the book’s strong causal claims, that most studies find small and inconsistent associations, and that blaming phones risks distracting from other causes of distress.
Haidt replied on his Substack, After Babel, that she had underplayed the experiments and natural experiments, such as studies of people who deactivated social media and of areas that gained fast internet at different times, which he said point towards harm.
Read side by side, the two camps disagree less about the data than it first appears. Both accept that average associations between overall screen time and wellbeing are small. They differ on how much weight to give to the heavier-using, younger and more vulnerable groups, on how strong the causal evidence is, and on whether to act before it is stronger. That last question is about values and risk, not just statistics.
Governments have started answering it anyway. Australia’s minimum age of 16 for social media accounts took effect in December 2025, and researchers will be watching closely for whether anything measurable changes.


How much time UK adults really spend online
Most of the big studies are about teenagers, but the weekly guilt is very much an adult experience. The most recent official UK figures come from Ofcom’s Online Nation report, published in December 2025.
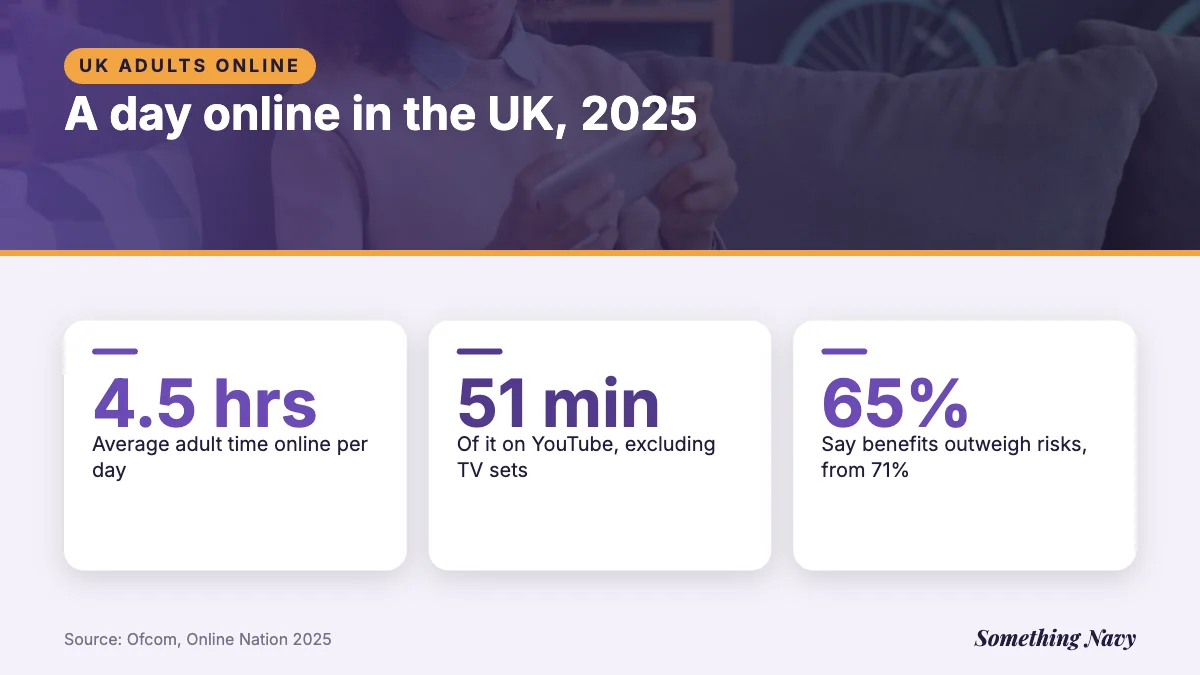
UK adults spent an average of 4.5 hours a day online, 10 minutes more than the year before, most of it on smartphones. Women averaged 4 hours 43 minutes, 26 minutes more than men. YouTube alone took 51 minutes a day, not counting viewing on a TV set.
Yet attitudes are cooling. Only 33% of adults felt the internet was good for society, down from 40% a year earlier. The share who believed the personal benefits of being online outweighed the risks fell to 65%, from 71% two years before.
Children, by Ofcom’s count, are not simply suffering through it either. Among 13- to 17-year-olds who use social media or messaging, 72% said it helped them feel closer to their friends.
Hours are rising. Comfort is falling. Those two trends together may explain the weekly jolt better than any study does.
Audit your own screen time without the guilt
If the total is a blunt instrument, a sharper one is easy to build. The research points towards three questions: what you are doing, when you are doing it, and how you feel afterwards. A week of honest notes will tell you more than a year of weekly reports.
Try this: a seven-day screen audit
- Split the total. Open your phone’s breakdown by app and sort it into four piles: connecting (calls, messages), making or learning, consuming you chose, and drifting (feeds you opened without deciding to).
- Check the clock. Note how much use falls in the hour before sleep. Pushing back bedtime is one of the more consistent ways screens seem to cost people.
- Do a one-word mood check. When you close an app, give yourself one word: better, same or worse. After a week the pattern is usually obvious.
- Watch for comparison. If certain accounts reliably leave you feeling behind, that is the envy pathway Verduyn and Kross measured. Mute them before you cut anything else.
- Notice what it replaced. Ask whether the time came out of sleep, exercise or attention to the person sitting opposite you. Those trade-offs are often where the cost really sits.
Then change one thing, not everything. Keeping the phone out of the bedroom and charging it elsewhere, which also helps with the sleep questions around blue light, is a small change with a clear rationale. If one app keeps landing in the “worse” column, removing it from your home screen is a fair experiment. A full break is a bigger step; the evidence on quitting social media is more mixed than the testimonials suggest.
For parents, the same logic applies with more care for age. The 2022 research suggests early adolescence deserves particular attention, especially around social media, more than a fixed nightly allowance for every kind of screen.
The useful question was never “how many hours?” It was always “hours of what, instead of what, and at what cost?”
Your phone can only answer the first part. The rest is yours to notice.
Frequently asked questions
There is no evidence-based daily limit for adults. Research points more to what the time displaces, such as sleep, exercise and in-person contact, and to how specific apps leave you feeling.
Early experiments linked passive Facebook browsing to envy and lower mood, but a 2022 review of 40 studies found the active-versus-passive split mostly unsupported. What you see, and how prone you are to comparison, seems to matter more.
Researchers still disagree. Average associations are small, but some studies find stronger links for heavy social media use and at particular ages, and causal evidence is contested.
They measure time more accurately than memory does, which is why many studies relying on self-reported hours are limited. They cannot measure what the time was used for or how it affected you.
Official links and research
- Przybylski, A. K., & Weinstein, N. (2017). A large-scale test of the Goldilocks hypothesis: Quantifying the relations between digital-screen use and the mental well-being of adolescents. Psychological Science, 28(2), 204–215. DOI
- Orben, A., & Przybylski, A. K. (2019). The association between adolescent well-being and digital technology use. Nature Human Behaviour, 3, 173–182. DOI
- Verduyn, P., Lee, D. S., Park, J., Shablack, H., Orvell, A., Bayer, J., Ybarra, O., Jonides, J., & Kross, E. (2015). Passive Facebook usage undermines affective well-being: Experimental and longitudinal evidence. Journal of Experimental Psychology: General, 144(2), 480–488. DOI
- Valkenburg, P. M., van Driel, I. I., & Beyens, I. (2022). The associations of active and passive social media use with well-being: A critical scoping review. New Media & Society, 24(2), 530–549. DOI
- Orben, A., Przybylski, A. K., Blakemore, S.-J., & Kievit, R. A. (2022). Windows of developmental sensitivity to social media. Nature Communications, 13, 1649. DOI
- Office of the US Surgeon General. (2023). Social media and youth mental health: The US Surgeon General’s advisory. US Department of Health and Human Services. Link
- Ofcom. (2025). Online Nation 2025: From apps to AI search, how the UK goes online. Link
- Odgers, C. L. (2024). The great rewiring: Is social media really behind an epidemic of teenage mental illness? Nature, 628, 29–30. DOI
Cover photo: Milad Fakurian on Unsplash. Charts and graphics: Something Navy, with photography by Dipqi Ghozali, ROBIN WORRALL and Vitaly Gariev on Unsplash.
How we reported this. Every figure was checked against the 8 sources above. Reviewed by Brooke Hilland, Senior Content Editor. Report an error · How we work