

Your annual review runs to four pages. Your manager says you are dependable, generous with colleagues, quick to learn and good in a crisis. Then, near the bottom, one line: “Could be more proactive in meetings.”
You read the whole thing once. You read that line eleven times.
By the evening you have forgotten the exact wording of the praise, but you could recite the criticism under oath. You replay it in the shower. You draft imaginary replies. You wonder whether “proactive” is code for something worse. The four pages of good news have, somehow, been outvoted by nine words.
If that sounds familiar, you are not unusually fragile. You are running software almost every human ships with.
What negativity bias is, and why psychologists think we have it
The label for this is negativity bias: the tendency for bad events, feedback and information to weigh more heavily than good things of equal size. “Of equal size” is doing the real work. Nobody is surprised that a car crash outweighs a nice sandwich. The puzzle is that a criticism and a compliment of matched intensity do not land with matched force.
In 2001 two papers, published in the same year, turned a scattered set of findings into something close to a law of psychology.
“Bad is stronger than good”
The first came from Roy Baumeister, Ellen Bratslavsky and Kathleen Vohs at Case Western Reserve University, with Catrin Finkenauer of the Free University of Amsterdam. Their review in Review of General Psychology carried one of the bluntest titles in the field: Bad Is Stronger Than Good. They trawled through research on close relationships, emotions, learning, feedback, health and impression formation, and kept finding the same asymmetry. Bad parenting, bad feedback and bad emotions had more impact than their good counterparts. Exceptions, where good reliably beat bad, were vanishingly rare.
Some of the individual findings they gathered are wonderfully specific. In one study of daily wellbeing, a bad day tended to drag down the following day’s mood, while a good day left no measurable trace on the next one. (The authors flag that this was correlational, so it shows a pattern rather than proving cause.) In older research on marriages, couples’ negative behaviours explained around 65% of the variation in how satisfied they felt, against 25% for supportive behaviours, even though the positive behaviours outnumbered the negative ones by about three to one.
Their explanation was evolutionary. Miss a chance at something good and you may feel regret later. Miss a single sign of danger and you may not have a later. An ancestor slightly too jumpy about rustling grass lost some lunch breaks; one slightly too relaxed lost everything.
Dominance, potency and the cockroach in the soup
The second paper, by Paul Rozin and Edward Royzman, appeared in Personality and Social Psychology Review and pulled the idea apart into components. In their account, negativity bias shows up in four ways. Negative things are more potent than equally strong positive ones. Our reaction to something bad grows more steeply as it gets closer in time or space. When good and bad are mixed together, the overall verdict tilts more negative than simple arithmetic would predict. And negative experiences are more varied and finely differentiated: we have more words, and more distinct responses, for the many flavours of bad.
The third point, which they called negativity dominance, is the one you have met in the review scenario. Their review leans heavily on contagion, and a kitchen version makes the point. One brief contact with a cockroach can make a whole bowl of soup inedible; no amount of contact with your favourite food will make a bowl of cockroaches appetising. As the pair put it, “negative entities are more contagious than positive entities.”
A single drop of bad can spoil a whole bowl of good, but no amount of good ever rescues a bowl of bad.
Where it starts: babies, brains and the speed of bad news
If negativity bias were a habit of grumpy adults, it might arrive with mortgages and group chats. The evidence points the other way.
It shows up early
In 2008 Amrita Vaish, Tobias Grossmann and Amanda Woodward published a review in Psychological Bulletin titled Not All Emotions Are Created Equal. Their argument was that the bias is already visible in infancy, particularly in studies of social referencing, where babies faced with an unfamiliar object look to a parent’s face and voice for clues about whether it is safe. The review argues that the adult habit of attending to, learning from and using negative information more than positive information is already at work in that infant research. The authors also set out testable predictions for future studies, a sensible admission that the case was not closed.
It shows up fast
Neuroscientists had already asked a sharper question. Is negativity bias bolted on later, when we deliberate? Or does it happen the moment the brain first sorts an experience into “good” or “bad”?
Tiffany Ito, Jeff Larsen, Kyle Smith and John Cacioppo tackled this in a 1998 paper in the Journal of Personality and Social Psychology with a title that does its own press release: Negative information weighs more heavily on the brain. They recorded event-related potentials, tiny voltage changes measured at the scalp, while volunteers looked at a stream of positive, negative and neutral photographs. The pictures were matched so that positive and negative images appeared equally often and were rated as equally extreme and equally arousing.
The signal they tracked was the late positive potential, a brainwave the authors note shares many features with the better-known P300. Both pleasant and unpleasant pictures produced a bigger response than neutral ones, as you would expect. But unpleasant pictures produced a bigger response than pleasant ones. In the first experiment the average amplitude for negative targets was about 10.9 microvolts against 7.4 for positive; in the second, measured at a parietal electrode, the gap was roughly 17.0 against 13.0.

Studies like this come with small print. The analysed samples were modest, 25 people in the first experiment and 14 in the second, which is typical for the era and the method but small by today’s standards. What makes the study persuasive is less its size than its design: the researchers removed the obvious alternative explanations (that bad pictures were simply rarer, more intense or more exciting) and the asymmetry stayed. The bias, in other words, seems to be built in at the sorting stage, before you have had a chance to think about it.
It sells headlines
You can watch the same machinery at work at a planetary scale. In 2023 a team including Claire Robertson and Jay Van Bavel of New York University and Stefan Feuerriegel of LMU Munich published an analysis in Nature Human Behaviour of headline experiments run by the news site Upworthy, which routinely tested several versions of the same story’s headline on live readers. Working with 12,448 of these randomised tests, covering 53,699 headlines, they found that each extra negative word in a headline of average length lifted the click-through rate by about 2.3%. Each extra positive word nudged it down by about 1%.
The follow-up is the best part. In 2025 the researchers M. V. Reiss and H. Roggenkamp re-ran the analysis for the Institute for Replication. They could reproduce the original results, and the negativity effect held up when they swapped the original word-counting method for sentiment ratings from large language models. The positivity penalty did not survive that switch. So: bad words reliably pull clicks, while the idea that good words actively repel readers looks shakier. Even the bias research has a bias toward the bad half of the story.
Loss aversion: how much more do losses really hurt?
Economists have their own version of negativity bias, and it comes with a number attached.
In 1979 Daniel Kahneman and Amos Tversky published prospect theory in Econometrica. One of its core claims was that we judge outcomes as gains or losses relative to where we started, and that the curve for losses is steeper than the curve for gains. Losing £50 stings more than finding £50 delights. This idea became known as loss aversion, and in later work Tversky and Kahneman put a figure on it: a loss aversion coefficient of about 2.25, meaning losses weigh roughly twice and a quarter as much as equivalent gains.
That figure took on a life of its own in textbooks and slide decks. Then people started poking at it.
The sceptics
In 2018 David Gal and Derek Rucker published a provocative review in the Journal of Consumer Psychology called The Loss of Loss Aversion. They argued that the evidence, taken as a whole, does not show that losses are generally more powerful than gains. Sometimes losses do loom larger; often the asymmetry depends heavily on context. They also asked why a whole field keeps treating the principle as settled when the evidence is this patchy.
The meta-analysis
The most thorough attempt to settle the size question came in 2024, when Alexander Brown of Texas A&M University, Taisuke Imai of Osaka University, Ferdinand Vieider of Ghent University and Colin Camerer of Caltech published a meta-analysis in the Journal of Economic Literature. They pooled 607 estimates of the loss aversion coefficient from 150 articles published between 1992 and 2017, spanning economics, psychology and neuroscience.
Their best estimate for the average coefficient was 1.955, with a 95% credible interval running from about 1.82 to 2.10. Around 94% of the individual estimates sat above 1, the line where losses and gains would count equally. The famous 2.25, they noted, came from 25 graduate students making choices with no real money at stake, and to their eyes it “seems a bit too high” as a typical value.
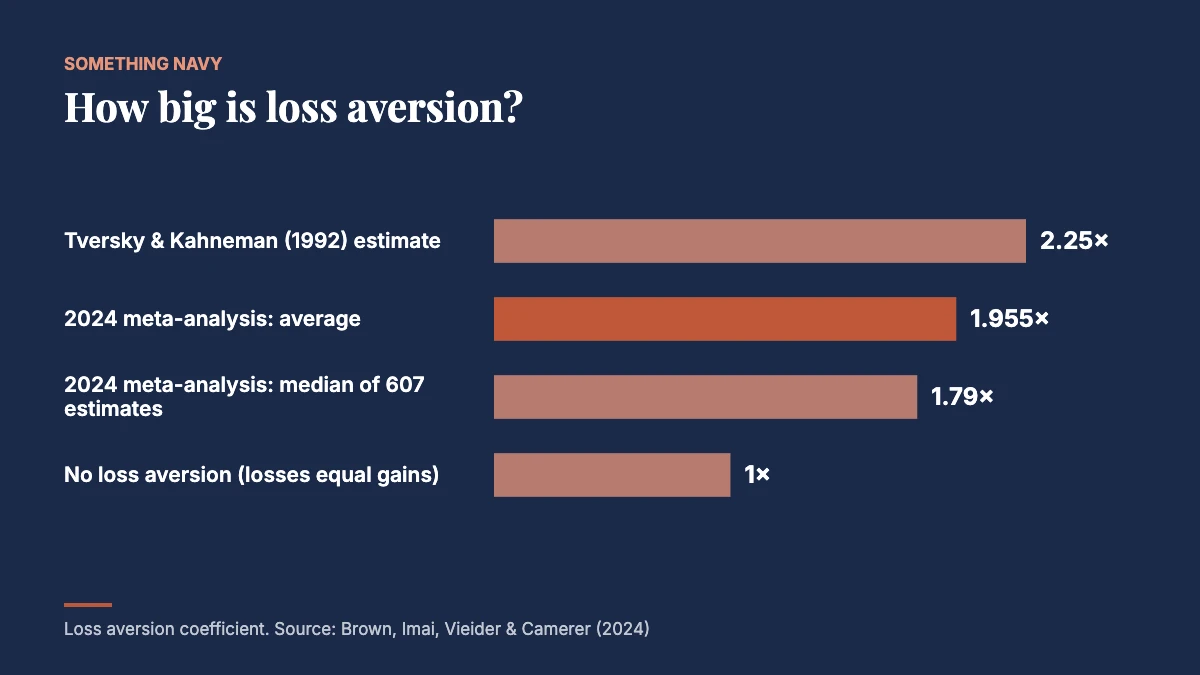
So who wins? Both camps, a little. Loss aversion is real on average and closer to two than to one. But individual estimates ranged enormously, and the authors found higher values in field studies and general-population samples than in lab studies with students, so Gal and Rucker’s call for context survives. Losses tend to count for roughly twice as much as gains, depending on who you ask and how.


The 5:1 ratio: where it came from and how it got stretched
Which brings us to the number you came for. “It takes five compliments to cancel out one criticism” has become received wisdom in management books and wedding speeches. It is a lovely rule, and a long way from what the original research measured.
What Gottman and Levenson actually found
The ratio traces back to John Gottman of the University of Washington and Robert Levenson of the University of California, Berkeley. In a study published in the Journal of Personality and Social Psychology in 1992, they brought married couples into the lab in 1983 and asked them, among other tasks, to spend 15 minutes discussing an area of ongoing disagreement. Every turn of speech was coded for positive and negative behaviours using a standard observational system. Four years later, in 1987, they caught up with 73 of the couples.
The couples the researchers called “regulated” were those in which positive moments steadily pulled ahead of negative ones over the conversation. Their ratio of positive to negative codes came out at roughly five to one: 5.76 for wives and 5.82 for husbands. In the “nonregulated” couples, negative codes matched or outnumbered positive ones, with ratios of 0.67 for wives and 1.06 for husbands. Those nonregulated couples were more likely to have seriously considered ending the marriage (71% against 33%) and more likely to have separated (about 36% against 17%) by the follow-up.

That is a genuinely useful finding. But notice what it is not.
It is a ratio of behaviours observed during a 15-minute conflict discussion. It is not a tally of compliments and criticisms across a working week. The Gottman Institute’s own explainer is explicit that the 5:1 ratio applies to conflict, and describes a ratio of one to one or lower during an argument as the worrying sign. The ratio emerged as a descriptive average of the couples who did well, not a threshold that was tested and shown to cause good outcomes. It came from 73 married couples, not from offices, classrooms or friendships. And 5.76 versus 0.67 is a contrast between groups, not proof that 4.9 spells doom and 5.1 spells bliss.
None of this makes Gottman’s work trivial; his later ideas about criticism, contempt, defensiveness and stonewalling are covered in our piece on Gottman’s four horsemen. The problem is the leap from “happy couples in conflict tended to be about five-to-one positive” to “you must deliver five compliments before you are allowed to give feedback”. That second sentence is a management slogan wearing a lab coat.
The cautionary tale of 2.9013
If you want to see what happens when a psychology ratio gets too precise, look at what came next.
In 2005 Barbara Fredrickson of the University of North Carolina and the consultant Marcial Losada published a paper in American Psychologist proposing that people flourish when their ratio of positive to negative emotions exceeds a critical value. That value, derived from equations borrowed from fluid dynamics, was 2.9013. Not “about three”. Two point nine zero one three. The Losada ratio, as it became known, spread quickly through positive psychology.
In 2013 Nicholas Brown, then a graduate student, teamed up with the physicist Alan Sokal and the psychologist Harris Friedman to take the maths apart. Their critique in American Psychologist argued that the differential equations had no justification for describing human emotions and were riddled with conceptual and mathematical errors. Losada declined to defend the model, Fredrickson said she had come to doubt it, and in September 2013 the journal issued a correction stating that “the modeling element of this article is formally withdrawn as invalid,” along with the predicted ratios. The underlying data from the paper’s samples were left standing, as Retraction Watch reported at the time.
When a feeling comes with four decimal places, check the maths before you check yourself.
The lesson is not that positivity is useless. It is that emotional life has no fixed exchange rate. Bad does seem to outweigh good across many settings; how much depends on the domain, the stakes and the measuring. Anyone selling you a single magic number is selling the number, not the science.
By the numbers
- 5.76 and 5.82: the positive-to-negative ratios of wives and husbands in Gottman and Levenson’s “regulated” couples during a 15-minute conflict discussion.
- 1.955: the average loss aversion coefficient across 607 estimates in a 2024 meta-analysis, down from the classic 2.25.
- 2.3%: the rise in click-through rate for each extra negative word in an average-length Upworthy headline.
- 65% versus 25%: how much of the variation in marital satisfaction negative and supportive behaviours explained in one study cited by Baumeister and colleagues.
- 2.9013: the “critical positivity ratio” whose mathematical basis was formally withdrawn in 2013.
How to live with a brain that rates bad news higher
So where does that leave you, still replaying “could be more proactive in meetings” at midnight? There is no cure, and negativity bias looks less like a bug than a smoke alarm that sometimes goes off for toast. What follows are sensible adjustments inferred from the studies above, not interventions tested in trials of their own.
Know which ratio you are actually using. The five-to-one figure describes how couples behaved during a disagreement. If you are a manager, a parent or a partner, the more useful takeaway is the shape of it: in a hard conversation, warmth, humour and acknowledgement need to outnumber the jabs by a wide margin. That is not the same as padding every piece of feedback with five compliments, which most people can smell from across the office.
Give criticism a waiting room. The bad-day finding suggests a rough moment can spill into tomorrow in a way a good moment does not. When a critical comment lands, try not to respond or decide anything until it has had a night to settle. It often feels smaller in the morning, once your brain’s first-pass alarm is no longer the only voice in the room.
Read the whole review, then reread it. Because the brain flags the negative line first and loudest, deliberately return to the positive parts and give them the second, third and fourth readings you instinctively gave the criticism. It feels silly. It is also how praise gets equal rehearsal time.
Write the good things down. Bad experiences come with vivid detail; good ones blur. Jotting a few specific positive moments from the day gives them the texture they lack, which is one reason people find gratitude practices helpful. Be specific: “she laughed at my joke in the stand-up” beats “work was fine”.
Respond to other people’s good news properly. If bad weighs more, small positive moments need help to register. Meeting a partner’s or friend’s good news with real interest, rather than a distracted “nice”, is a cheap way to add weight to the good side; we’ve covered how you respond to good news before.
Be suspicious of your own headlines. The Upworthy data suggest your attention is wired to click on the negative version of any story, including the story you tell yourself about your day. When you catch yourself framing something in the darkest available words, try writing the same event as a neutral headline. “Manager suggests more input in meetings” is a very different article from “Career quietly ending”.
Let criticism be information, not a verdict. One bad remark can colour a whole impression, but you get to decide whether it is a useful note or a final judgement. Asking “what would I do differently with this?” turns a threat into a task. If the voice in your head gets harsh, the research on self-compassion is worth a look.
Distrust tidy numbers, including friendly ones. The lesson of the Losada saga is to be wary of any formula that balances your emotional books to four decimal places. Bad is stronger than good. By how much, and for whom, is still being worked out, and that uncertainty is the science doing its job.
Official links and research
- Baumeister, R. F., Bratslavsky, E., Finkenauer, C., & Vohs, K. D. (2001). Bad is stronger than good. Review of General Psychology, 5(4), 323–370. DOI
- Brown, A. L., Imai, T., Vieider, F. M., & Camerer, C. F. (2024). Meta-analysis of empirical estimates of loss aversion. Journal of Economic Literature, 62(2), 485–516. DOI
- Brown, N. J. L., Sokal, A. D., & Friedman, H. L. (2013). The complex dynamics of wishful thinking: The critical positivity ratio. American Psychologist, 68(9), 801–813. DOI
- Gal, D., & Rucker, D. D. (2018). The loss of loss aversion: Will it loom larger than its gain? Journal of Consumer Psychology, 28(3), 497–516. DOI
- Gottman, J. M., & Levenson, R. W. (1992). Marital processes predictive of later dissolution: Behavior, physiology, and health. Journal of Personality and Social Psychology, 63(2), 221–233. DOI
- Ito, T. A., Larsen, J. T., Smith, N. K., & Cacioppo, J. T. (1998). Negative information weighs more heavily on the brain: The negativity bias in evaluative categorizations. Journal of Personality and Social Psychology, 75(4), 887–900. DOI
- Kahneman, D., & Tversky, A. (1979). Prospect theory: An analysis of decision under risk. Econometrica, 47(2), 263–292. DOI
- Robertson, C. E., Pröllochs, N., Schwarzenegger, K., Pärnamets, P., Van Bavel, J. J., & Feuerriegel, S. (2023). Negativity drives online news consumption. Nature Human Behaviour, 7(5), 812–822. DOI
- Rozin, P., & Royzman, E. B. (2001). Negativity bias, negativity dominance, and contagion. Personality and Social Psychology Review, 5(4), 296–320. DOI
- Vaish, A., Grossmann, T., & Woodward, A. (2008). Not all emotions are created equal: The negativity bias in social-emotional development. Psychological Bulletin, 134(3), 383–403. DOI
Cover photo: Age Cymru on Unsplash. Charts and graphics: Something Navy, with photography by Keith Tanner and Vitaly Gariev on Unsplash.
How we reported this. Every figure was checked against the 10 sources above. Reviewed by Brooke Hilland, Senior Content Editor. Report an error · How we work