You have almost certainly seen it. A curve shoots up from nothing to a sharp early peak, crashes into a trough, then climbs slowly and steadily to the right. The peak is usually labelled “Mount Stupid”. The trough is the “Valley of Despair”. Somewhere along the gentle slope, wisdom arrives.
It turns up in management slide decks, in arguments on X, under posts by people who have just watched one documentary about nutrition. The caption is nearly always some version of the same line: the people who know the least are the most sure of themselves. The Dunning-Kruger effect, the meme says, explains everyone you disagree with.
Here is the awkward part. That graph does not appear in the study it is named after. Nothing like it does.
The real 1999 paper, by two Cornell psychologists, contains a handful of plain line charts with four points on each line. What they show is genuinely interesting, partly true, and has spent the past decade being picked apart by statisticians.
The cartoon and the claims it smuggles in
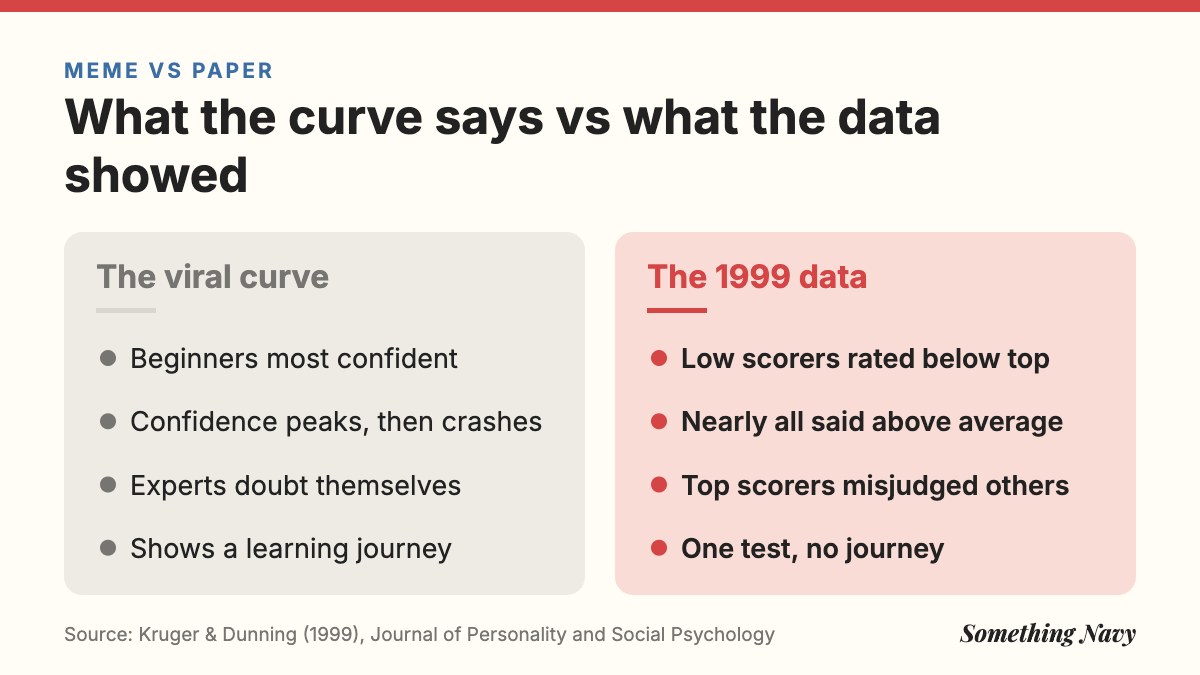
Before looking at the data, it helps to be precise about what the viral curve actually asserts. Its horizontal axis is usually knowledge or experience. Its vertical axis is confidence. Read literally, it makes three claims.
First, that beginners are more confident than almost anyone, including people with real expertise. Second, that gaining a bit of knowledge makes confidence collapse. Third, that true experts eventually regain confidence, but never quite reach the giddy heights of the novice.
None of those three claims was tested in the original research. The paper did not follow anyone over time as they learned, so there is no “journey” to plot. It did not measure confidence in the everyday sense either. It asked people to estimate how well they had done compared with their peers.
Four studies, 334 Cornell undergraduates
Justin Kruger and David Dunning published “Unskilled and unaware of it” in the Journal of Personality and Social Psychology in 1999. The design was simple and repeated four times with Cornell undergraduates, who took part for extra course credit.
In the first study, 65 students rated how funny 30 jokes were. Their answers were scored against the ratings of eight professional comedians. In the second, 45 students tackled 20 logical reasoning questions taken from an LSAT preparation guide, the test used for American law school admissions. In the third, 84 students answered 20 grammar questions from a guide for a teacher certification exam. The fourth study, with 140 students, used 10 logic puzzles based on the Wason selection task, a classic test of reasoning about rules.
After each test, participants estimated two things. How did their general ability in that area compare with other Cornell students, as a percentile? And how did their score on this particular test compare? The researchers then sorted everyone into quartiles by actual performance and compared what each group thought with what it achieved.
What the study did
- Who: 334 Cornell undergraduates across four studies
- Tasks: rating jokes, logical reasoning, grammar, and Wason-style logic puzzles
- Key measure: each person’s guess at their own percentile rank versus their real one
- Group size: the bottom quartile ranged from 11 people (Study 2) to 37 (Study 4)
Twelfth percentile, sixty-second guess
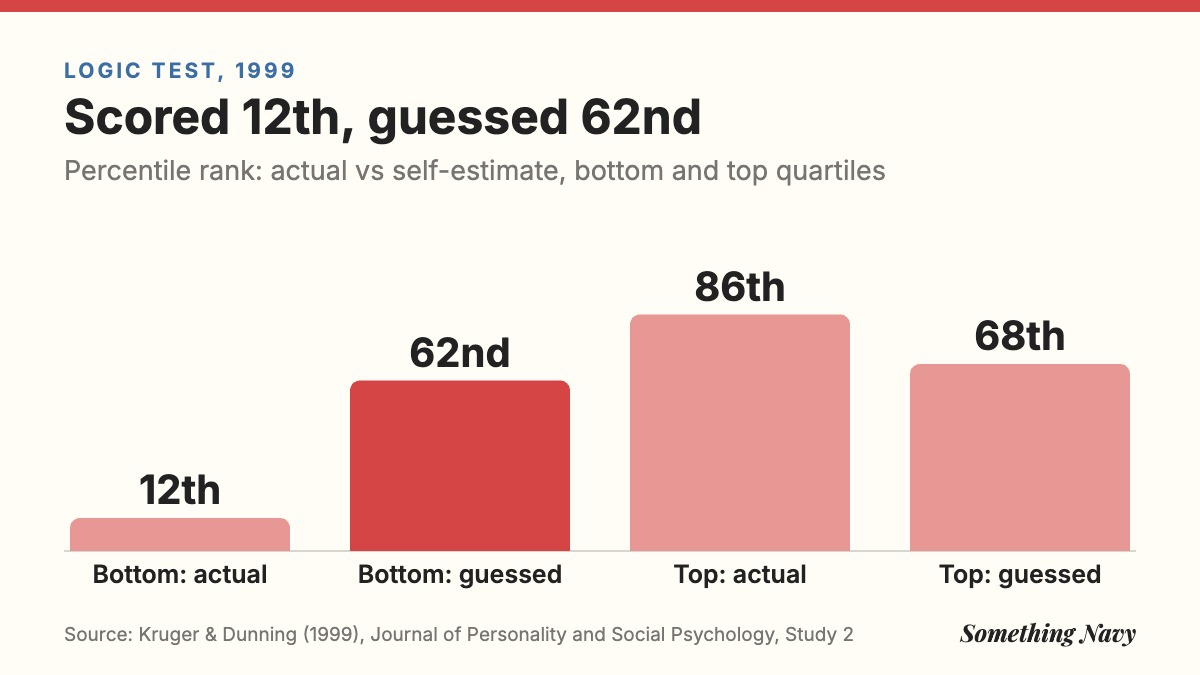
The headline result is the one quoted in the paper’s own abstract. Across the studies, people in the bottom quartile scored, on average, around the 12th percentile, yet estimated themselves to be in the 62nd.
The individual studies tell the same story with small variations. In the humour study, the bottom quartile actually sat at the 12th percentile but put their ability at the 58th. In the logical reasoning study, the bottom group also landed at the 12th percentile and guessed that their test score ranked at the 62nd. In raw terms, they thought they had answered 14.2 of 20 questions correctly. The real figure was 9.6.
The grammar study was similar: actual performance at the 10th percentile, estimated test performance at the 61st. The most striking gap came in Study 4, the logic puzzles. The bottom quartile believed they had solved 5.5 of the 10 problems. They had solved, on average, 0.3.
That is the real finding, and it is not trivial. The worst performers misjudged themselves by more than anyone else.
Meme claim: the ignorant are the most confident
Look again at the logical reasoning numbers, and the cartoon starts to wobble. The top quartile scored at the 86th percentile and estimated their test performance at the 68th. The bottom quartile guessed the 62nd.
So the worst performers did not think they were better than the best performers. They thought they were slightly worse. In the grammar study the pattern held: the bottom group estimated their test score at the 61st percentile, the top group at the 70th. Wherever the paper reports figures for both groups, perceived rank rose as actual rank rose. The line simply rose much more gently than reality.
There is no Mount Stupid in this data. There is no peak of novice confidence towering over the experts. What the paper shows is closer to a flattened slope: nearly everyone placed themselves somewhere a bit above the middle, regardless of how they had actually done. The people at the bottom had the longest distance to fall, so their errors looked largest.
That “everyone thinks they’re above average” tendency is one of the oldest findings in social psychology, and as we will see, it becomes central to the critique. It is a close cousin of the spotlight effect, in which we overestimate how much others notice us.
Meme claim: experts are riddled with doubt
The second half of the cartoon, where knowledge brings humility, also gets a partial correction. Top performers in the 1999 studies did underestimate themselves. But Kruger and Dunning argued that the reason was different and rather flattering.
The skilled students were not anxious about their own answers. In the raw scores they were often close to right: the top quartile in the grammar study estimated 16.9 correct answers and actually got 16.4. Their mistake was assuming everyone else had found the test as easy as they did. In the authors’ words, “the miscalibration of the highly competent stems from an error about others.”
Study 3 tested this directly. Participants were shown tests completed by classmates and asked to grade them. After seeing how others had done, the top quartile raised their estimates of their own percentile substantially. The bottom quartile did not. They were also much worse at grading: the correlation between their grades and the real scores averaged .37, against .66 for the top group.
If you recognise yourself in the doubting expert, the better-studied cousin is imposter syndrome, which has its own tangled evidence base.
The dual burden, and a cure that worked
Kruger and Dunning’s explanation was elegant. To judge whether an answer is good, you need roughly the same knowledge required to produce a good answer. Someone who does not understand a grammar rule cannot spot that they have broken it. Their incompetence, as the paper puts it, “robs them of the metacognitive ability to realize it.”
The skills that engender competence in a particular domain are often the very same skills necessary to evaluate competence.
Kruger & Dunning (1999)
They even opened the paper with Charles Darwin, who wrote in 1871 that “ignorance more frequently begets confidence than does knowledge.”
The fourth study is the part that tends to get left out of the meme, and it is the most hopeful. After the logic test, half the participants received a short training session on how to solve that kind of puzzle. The others did an unrelated task. Then everyone re-rated their performance on the test they had already taken.
The trained members of the bottom quartile revised their estimate of their test score from the 51st percentile down to the 32nd. Their estimate of how many problems they had solved dropped from 5.3 to 1.0, much closer to the real figure of 0.4. The untrained bottom quartile barely changed their minds. Once the weakest students had learnt the logic, they could see their earlier mistakes. “The incompetent had become experts,” the authors wrote, at least at judging their own answers.
Note the scale, though. The trained bottom-quartile group contained 19 people. This was clever work, but on small samples of students at one elite American university.
Then the statisticians arrived
From the start, Kruger and Dunning knew about one awkward possibility: regression to the mean. Their paper acknowledged that “the regression effect virtually guarantees” part of the result, but argued that the overestimation was “more psychological than artifactual”.
Here is the problem in plain terms. Any test score is partly skill and partly noise. Someone who lands in the bottom quartile is there partly because of genuine weakness and partly because of bad luck on the day. Their own estimate of their ability will not share that bad luck. So, on average, it will sit higher than the score. The reverse happens at the top. Sort people by a noisy measure and the extremes will always look miscalibrated, even if nobody has a special blind spot.
Now add the second ingredient: most people rate themselves as somewhat above average, on almost anything. Combine a general above-average bias with ordinary regression to the mean, and you get the 1999 graph almost for free. The bottom group overestimates a lot, the top group underestimates a little, and the lines cross somewhere near the top.
Psychologists Krueger and Mueller made a version of this argument as early as 2002. But the most vivid demonstrations came later, and from an unusual direction.
Random numbers drew the same shape
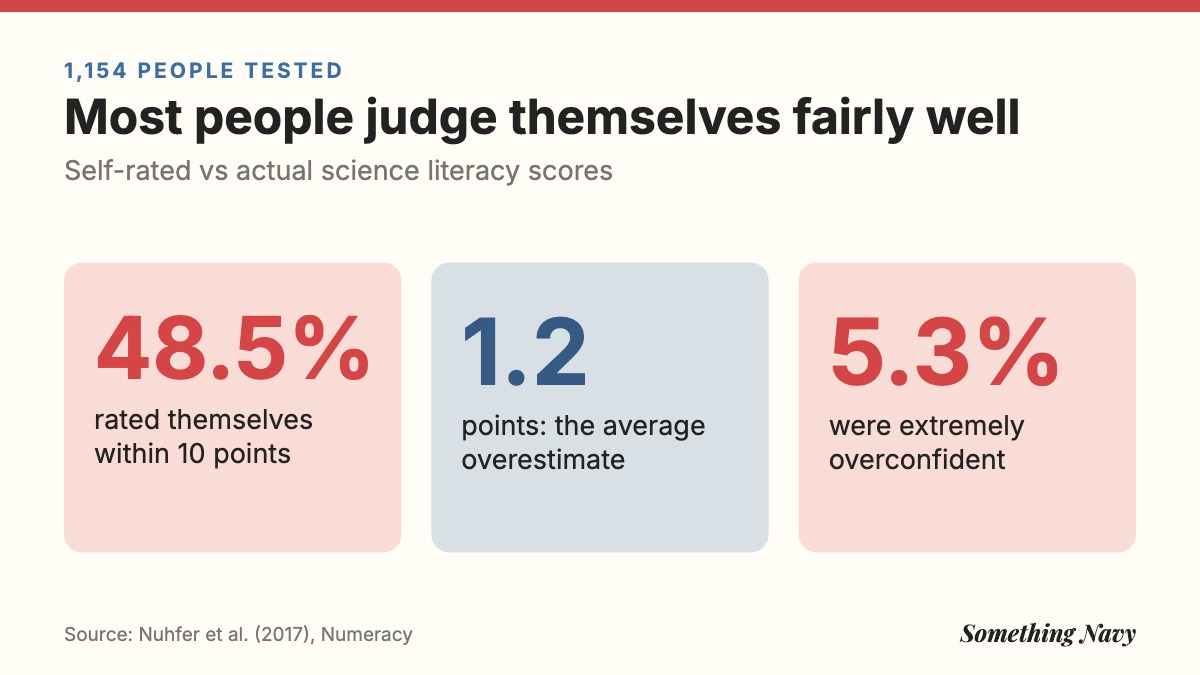
Edward Nuhfer and colleagues were interested in how well students and academics could judge their own science literacy. In two papers in the journal Numeracy, in 2016 and 2017, they looked at 1,154 people who took a science literacy test and also rated their own competence on it.
Their key move was to feed the same kind of analysis with random numbers, with no relationship at all between “self-assessment” and “score”. Sorted into quartiles and plotted in the Kruger-Dunning style, the random data produced quartile averages that differed “greatly and systematically” from one another. Pure noise generated the look of an effect.
When they examined their real participants using methods less prone to that artefact, the picture was surprisingly reassuring. About 48.5% of people rated themselves within 10 percentage points of their actual score. On average, the whole group overestimated by just 1.2 points. Only 5.3% were extremely overconfident.
Novices and experts did differ, but modestly. Novices overestimated by 2.1 points on average, while experts underestimated by 2.4. Expertise brought tighter calibration, not a dramatic cure for delusion.
929 intelligence tests and a flat line
In 2020 the psychologists Gignac and Zajenkowski took the question to intelligence, the domain where overconfidence jokes are most popular. Their paper in the journal Intelligence drew on 929 adults from the general community, who completed Raven’s Advanced Progressive Matrices, a widely used reasoning test, and rated their own intelligence.
Analysed the traditional way, by quartile, the data produced the familiar Dunning-Kruger picture. Low scorers overestimated much more than high scorers. Then the researchers applied two methods designed to detect a real effect without the regression trap.
The first asked whether people’s self-estimates became less accurate as their ability fell. The correlation was -0.05 and not statistically significant. The second tested whether the relationship between real and perceived intelligence bent in the way the theory predicts. It did not; the line was essentially straight. Their title summed it up: the effect is “(mostly) a statistical artefact”. If it exists, they wrote, its magnitude “may be much smaller than reported previously”.
Note the word “mostly”. Gignac and Zajenkowski did not claim to have proved the effect was zero everywhere. They suggested some samples, including the humour study in the original paper, may show a real effect on top of the artefact.
What survives the critique
The strongest recent evidence for a genuine effect comes from a 2021 study in Nature Human Behaviour by Rachel Jansen, Anna Rafferty and Thomas Griffiths. They ran a large replication of the original grammar and logical reasoning tasks, with around 4,000 participants in each of two studies, many times the original sample.
Instead of eyeballing quartile charts, they built a mathematical model of how a reasonable person estimates their own performance, with and without a special weakness in low performers. The version that fitted best was the one in which low performers were less able to tell whether each of their answers was right.
That is a narrower, more technical claim than the meme makes. But it is very close to what Kruger and Dunning originally proposed. Low performers really do seem to have a harder time spotting their own errors in at least some domains. What looks doubtful is the size of the effect in the famous graphs, and the idea that it produces a peak of confidence among beginners.
It is also telling that the original authors drew limits around their claim. They did not argue that people are always unaware of their incompetence. In areas where feedback is obvious, they noted, such as sport or art, people can become acutely, even painfully, aware of their limits. Few people overrate their ability to translate Slovenian proverbs, to borrow their example.
How to use the idea without becoming the punchline
The most ironic thing about the Dunning-Kruger meme is that it is usually deployed by someone confident they are not the one on Mount Stupid. The research gives no licence for that. In the 1999 data almost everyone, top and bottom, thought they were above average. The bias is general; the blind spot is just wider where skill is thinner.
There is also a lesson in how the meme grew. A cautious finding about percentile estimates among a few hundred students became a tidy curve, then a universal law of human folly. Psychology has seen this before, with ideas such as power posing, where a striking early result outran its evidence.
The practical message from Study 4 is the one worth keeping. The cure for overestimating yourself was not humility lectures. It was learning. Once the weakest students understood how the logic puzzles worked, they could see exactly where they had gone wrong, and their self-assessments came crashing down to earth.
So the useful question is not “Am I on Mount Stupid?” It is “Would I be able to tell if I were wrong about this?” If the honest answer is no, the remedy is the same one that worked at Cornell: find out how the thing actually works, then mark your own homework again.
Sources
- Kruger, J., & Dunning, D. (1999). Unskilled and unaware of it: How difficulties in recognizing one’s own incompetence lead to inflated self-assessments. Journal of Personality and Social Psychology, 77(6), 1121–1134. DOI
- Nuhfer, E., Cogan, C., Fleisher, S., Gaze, E., & Wirth, K. (2016). Random number simulations reveal how random noise affects the measurements and graphical portrayals of self-assessed competency. Numeracy, 9(1), Article 4. DOI
- Nuhfer, E., Fleisher, S., Cogan, C., Wirth, K., & Gaze, E. (2017). How random noise and a graphical convention subverted behavioral scientists’ explanations of self-assessment data: Numeracy underlies better alternatives. Numeracy, 10(1), Article 4. DOI
- Gignac, G. E., & Zajenkowski, M. (2020). The Dunning-Kruger effect is (mostly) a statistical artefact: Valid approaches to testing the hypothesis with individual differences data. Intelligence, 80, 101449. DOI
- Jansen, R. A., Rafferty, A. N., & Griffiths, T. L. (2021). A rational model of the Dunning–Kruger effect supports insensitivity to evidence in low performers. Nature Human Behaviour, 5(6), 756–763. DOI
Cover photo: Carlos Gil on Unsplash. Charts and graphics: Something Navy.
How we reported this. We went back to the original research for this story, 5 sources in all, listed above, and checked every figure against them. If you think we have got something wrong, tell us and we will look at it. Read more about how we work.